RDPlot is a free and open source plotting application for Linux, Windows and MacOS. It is written in R and released under GNU General Public License v3.0 or later. Using RDPlot, you can plot rate distortion curves on your system. You can also calculate bjontegaard delta statistics, parse the output of HM, SHM, or VTM and data from formated files. You can also easily export all plots and BD statistics for camera ready presentation.
How to Install RDPlot on Ubuntu
To install RDPlot on your system, you need flatpak and flathub. If you don’t have then install flatpak and flathub on your system first and restart it after the installation. You can install flatpak using below two commands.
sudo apt install flatpak
flatpak remote-add --if-not-exists flathub https://flathub.org/repo/flathub.flatpakrepo
After that open the terminal application (ctrl+alt+t) and run below RDPlot flatpak install command.
flatpak install flathub de.rwth_aachen.ient.RDPlot
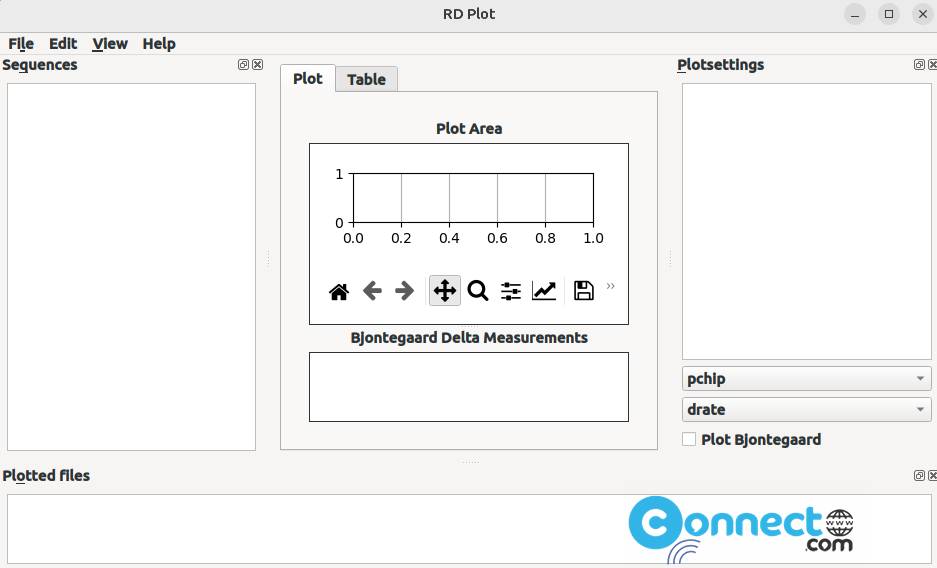
It will install the latest version of RDPlot on your system. You can open it using below command. Or via the show apps application menu.
flatpak run de.rwth_aachen.ient.RDPlot
And you can also uninstall it using below commands.
flatpak uninstall de.rwth_aachen.ient.RDPlot
[OR]
sudo flatpak uninstall de.rwth_aachen.ient.RDPlot