LogarithmPlotter 2D Plotter Software

  • Post last modified:January 20, 2022
  • Post category:Linux
  • Post author:

LogarithmPlotter is a free and open source 2D Plotter application for Linux, Windows and MacOS. Using LogarithmPlotter you can create dynamic plots, asymptotic Bode plots, sequences or statistical repartition functions and create, position, edit and delete objects. You can use this application for logarithmic and non-logarithmic plots. It is written in QML, JavaScript, Python and released under GNU General Public License version 3. It comes with advanced history system to easily rollback to a previous state of your diagram. You can also customize the diagram looks and easily save the plots.

logarithmplotter

(more…)

Continue ReadingLogarithmPlotter 2D Plotter Software

Interactive Graphing and Analysis with LabPlot

  • Post last modified:March 17, 2021
  • Post category:Linux
  • Post author:

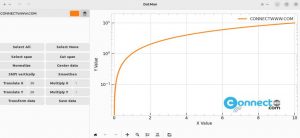
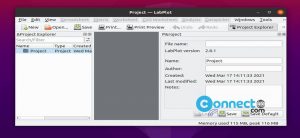
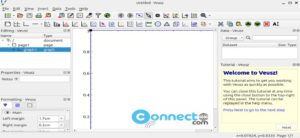
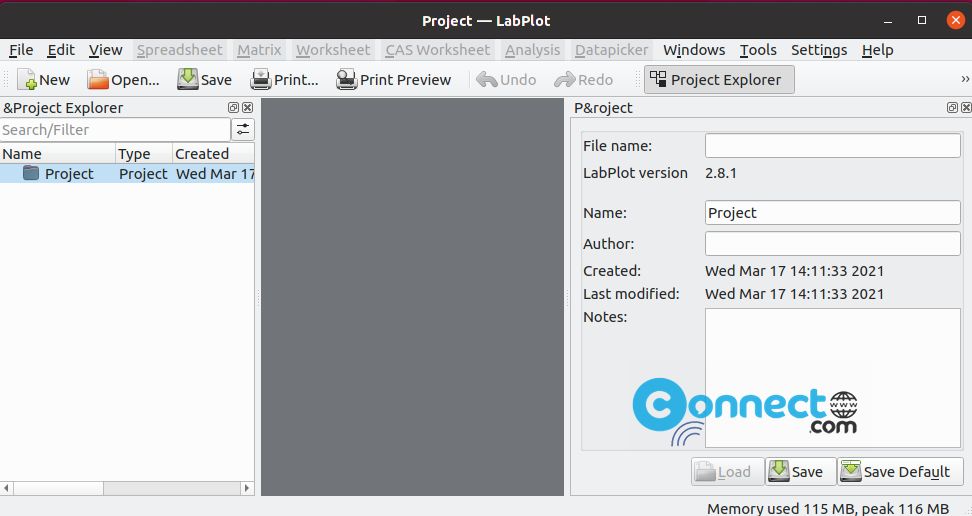
LabPlot is a free and open source graphing and analysis software for Windows, MacOS and Linux. Using LabPlot you can create, manage and edit plots. You can import data from spreadsheet or any other external files. You will get the final plots in several pixmap and vector graphic formats. It comes with project management, Worksheet, Latex syntax support, mathematical expressions support, linear and non-linear regression, numerical differentiation, interpolation, Fourier transform, convolution and Deconvolution of data sets, auto and cross-correlation of data sets and more.

LabPlot

(more…)

Continue ReadingInteractive Graphing and Analysis with LabPlot

How to install Veusz on Ubuntu – Scientific Plotting & Graphing app

  • Post last modified:January 9, 2020
  • Post category:Linux
  • Post author:

Veusz is a free and open source scientific plotting and graphing software for Windows, MacOS and Linux. Using Veusz you can draw 2D and 3D plots easily and you can use as a Python module for plotting also. Object-based plotting widgets are very important feature in veusz. It is used to create and customize your plots. Veusz supports data import from text, CSV, HDF5 and FITS and output in vector, bitmap, PDF, Postscript, SVG and EMF. It also supports plugin. Using this you can extend its features. It is released under GPL version 2 or greater licence. It is written in Python and c++.

(more…)

Continue ReadingHow to install Veusz on Ubuntu – Scientific Plotting & Graphing app